Screenshots
Spreadsheet Express installs its VIs in the Addons palette under the “Spreadsheet Express” sub-palette.
The following data sub-palette provides several ways to interact with the cell data in Excel spreadsheets.
The following graphing sub-palette provides the ability to create true formatted Excel charts with series’ and trendlines.
The following macro sub-palette provides the ability to add and run macros in an Excel workbook.
Theses examples are installed within the LabVIEW Example Finder. They can be found by typing in “SPX” in the search field. There are examples showing how to use Spreadsheet Express to automate graphing in Excel, link to named cells in templates, extract and write data to Excel workbooks, and add and run macros.
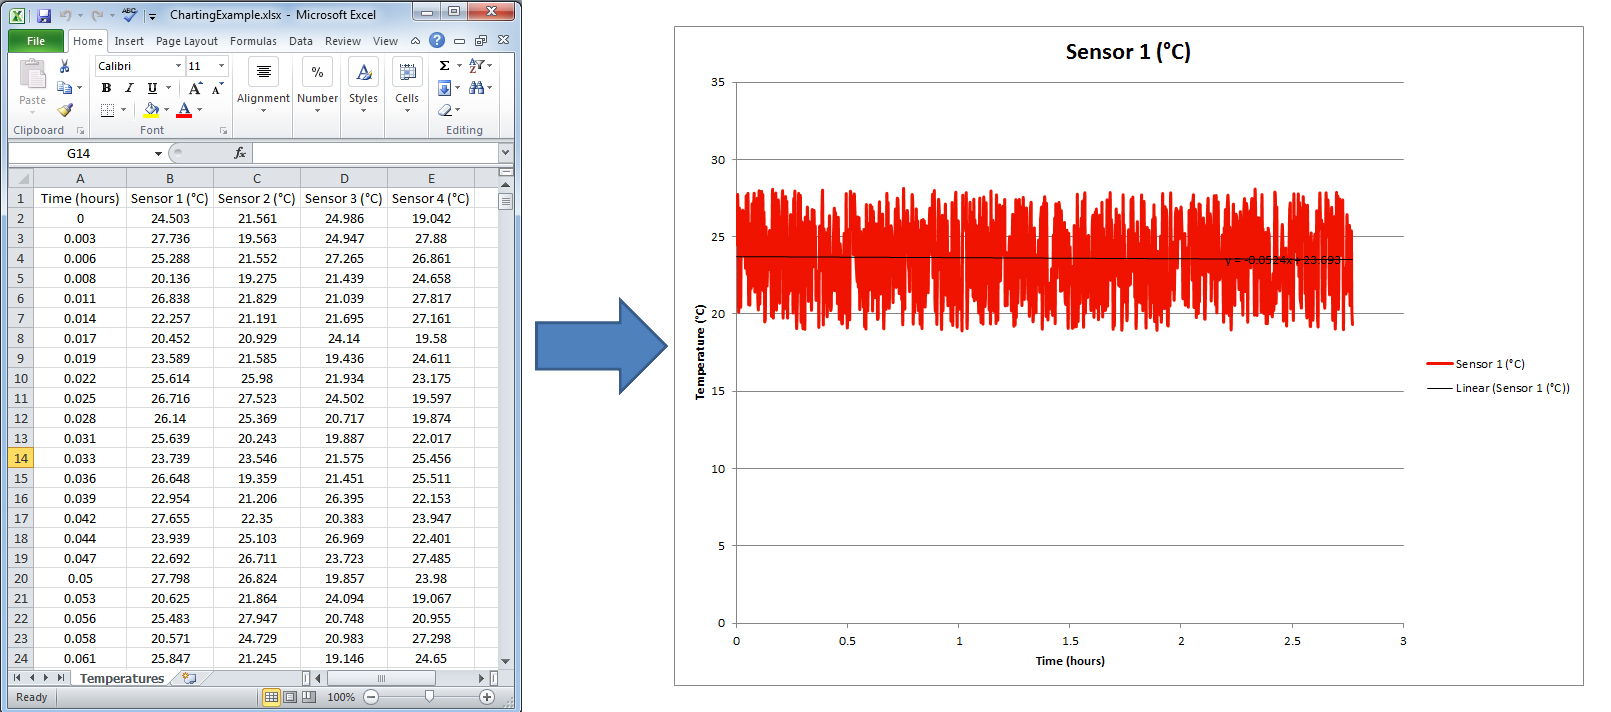
The Charting Example shows how to take an input Excel or delimited file with raw data in it and generate a nicely formatted Excel spreadsheet with charts and trendlines for each column of data.


![SpreadsheetExpress2[1]](https://www.aledyne.com/wp-content/uploads/2014/07/SpreadsheetExpress21.png)
![SpreadsheetExpress3[1]](https://www.aledyne.com/wp-content/uploads/2014/07/SpreadsheetExpress31.png)
![SpreadsheetExpress4[1]](https://www.aledyne.com/wp-content/uploads/2014/07/SpreadsheetExpress41.png)
![SpreadsheetExpress5[1]](https://www.aledyne.com/wp-content/uploads/2014/07/SpreadsheetExpress51.png)

 Aledyne is a leading LabVIEW solutions provider delivering cutting-edge products and services.
 The
The 


