Screenshots
SigmaDAQ Logger:
The SigmaDAQ Logger is intended to be installed on a computer that is connected to the data acquisition hardware. If the hardware is Ethernet or WiFi based, then this can be installed anywhere that has Ethernet access. On the main screen, two list-boxes on the left indicate which data acquisition devices/chassis are disconnected or connected. If a device becomes inaccessible during acquisition, it will be moved to the Idle list until it can be accessed again. The graph display displays real-time data for the device selected in the connected list. The amount of history of data displayed can be adjusted in the Settings menu. On the back-end, all data is also continuously streamed to a TDMS repository during acquisition.
The Channel Data tab provides information about each configured channel including the associated device, the unique channel name provided at configuration time, the timestamp and data of the last sample taken, units, and channel alert properties.
Configuring network based National Instruments chassis is easier than ever with the network chassis configuration tool. Through a single interface a network chassis can be discovered, renamed, and added to MAX all through SigmaDAQ without needing MAX. Also, using the “Configure” button, the devices’ webpage can be accessed directly so that other device settings can be changed, such as turning on the wireless radio for devices like the cDAQ-9191 WiFi chassis. If a device is behind a firewall and cannot automatically be discovered, this utility also provides the ability to manually add a device by entering an IP Address or hostname.
Configuring data acquisition of a device or chassis is an easy step-by-step process. Configurations can be saved and edited later if the hardware configuration changes.
Step 1: Select from a list of connected devices
Step 2: Configure hardware sampling rate and properties (continuous or burst mode)
Step 3: Configure channel properties for each desired channel including channel name, measurement type, individual channel sample rate, alerts, etc. Also test the channel to verify proper connections and configuration at setup time.
Optionally configure an alert on a channel with SMS messaging.
Real-Time SMS text alerts will notify you when one of your configured alerts has triggered or when a connected device has become inaccessible. When an alert is triggered you can optional transmit a graphical image of the data so that the trend can be visualized at the time of the alert.
Several settings can be configured including the location of the data repository, the real-time graph history, and mobile device carrier information.
SigmaDAQ Viewer:
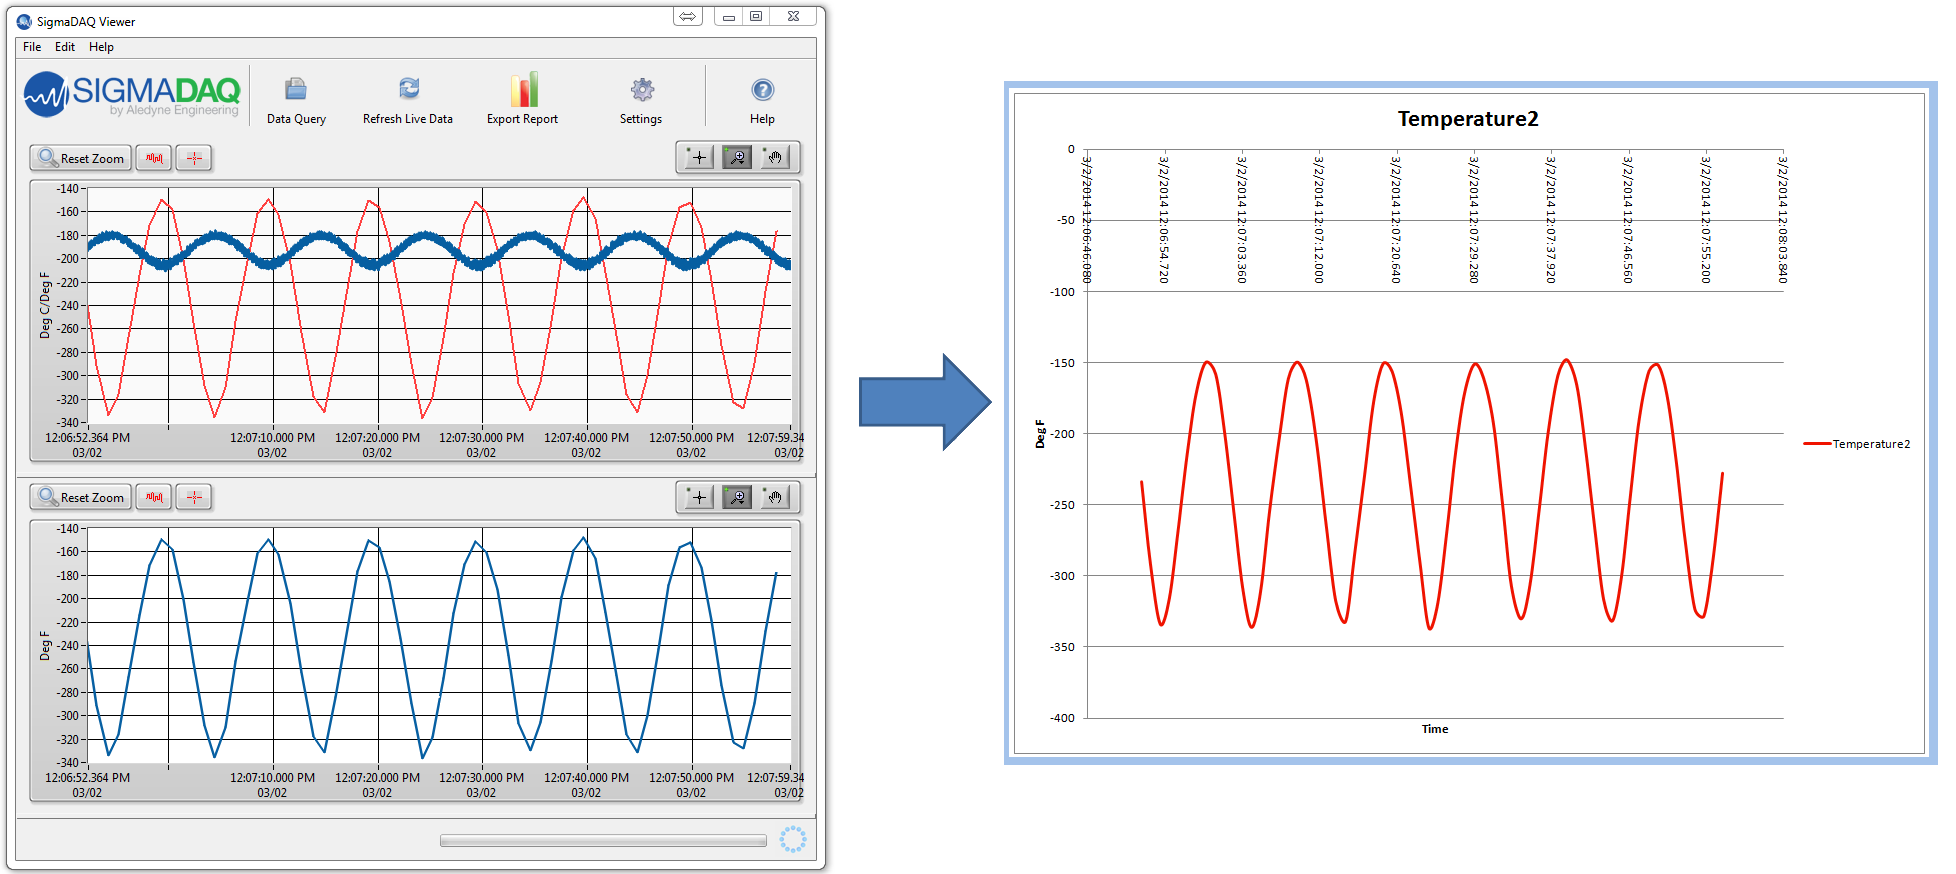
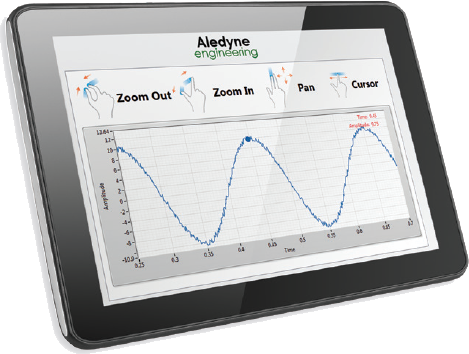
The SigmaDAQ Viewer can be installed on the same machine as the SigmaDAQ Logger as well as any number of machines locally or remotely with no additional licensing fees required. As long as the data repository directory is accessible, the Data Viewer can be used to access and analyze the data from multiple locations simultaneously. The Viewer provides an easy interface to query large datasets and find the data you need, allowing you to analyze it quickly and generate a report. Additional features include synchronizing the time axis of multiple graphs, enabling cursors, adding annotations, and decimating data before exporting it to an Excel or csv file.
Querying and viewing data is easy and fast with the SigmaDAQ Viewer.
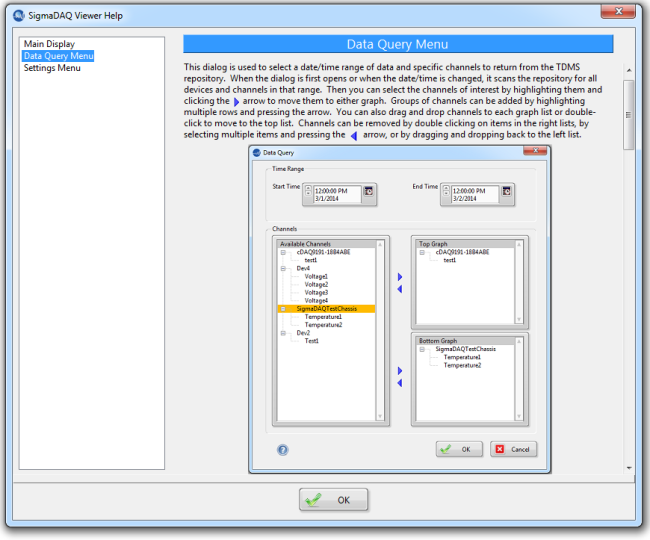
Step 1: In the Data Query menu select a date and time range of the devices and data you want to view. A list of devices with data within that time range will automatically populate on the left.
Step 2: Drag and drop channels from the left list to the top and/or bottom graph list on the right and press “OK”.
Step 3: While viewing the desired data, click the “Export Report” button to generate an Excel formatted report with charts created for each channel of data.
The SigmaDAQ Logger and Viewer also include detailed user help guides to help you get up and running quickly.

![SigmaDAQLogger[1]](https://www.aledyne.com/wp-content/uploads/2014/07/SigmaDAQLogger1.png)
![ChannelTab[1]](https://www.aledyne.com/wp-content/uploads/2014/07/ChannelTab1.png)
![FindDevices[1]](https://www.aledyne.com/wp-content/uploads/2014/07/FindDevices1.png)
![Config1[1]](https://www.aledyne.com/wp-content/uploads/2014/07/Config11.png)
![Config2[1]](https://www.aledyne.com/wp-content/uploads/2014/07/Config21.png)
![Config3[1]](https://www.aledyne.com/wp-content/uploads/2014/07/Config31.png)
![Alert[1]](https://www.aledyne.com/wp-content/uploads/2014/07/Alert1-300x198.png)
![SigmaDAQ_SMS[1]](https://www.aledyne.com/wp-content/uploads/2014/07/SigmaDAQ_SMS1-141x300.png)
![Settings[1]](https://www.aledyne.com/wp-content/uploads/2014/07/Settings1-300x152.png)
![Viewer2[1]](https://www.aledyne.com/wp-content/uploads/2014/07/Viewer21.png)
![Query[1]](https://www.aledyne.com/wp-content/uploads/2014/07/Query1.png)


 Aledyne is a leading LabVIEW solutions provider delivering cutting-edge products and services.
 The
The 


